
Transformando ideas en soluciones
Transformamos tus procesos con tecnología inteligente y diseño funcional
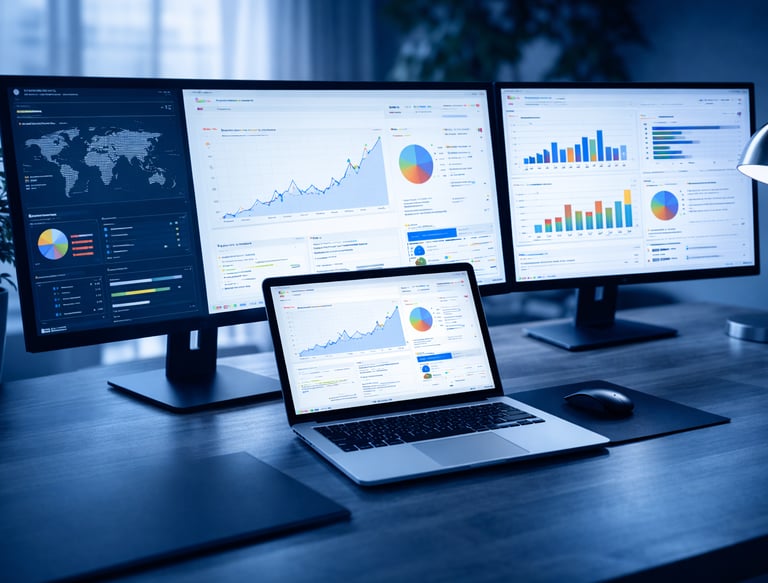
Análisis de Datos
Implemento soluciones analíticas que optimizan la toma de decisiones y mejoran el rendimiento de sistemas mediante técnicas modernas y un enfoque riguroso en el análisis de datos.


Desarrollo Web
Transformo ideas en soluciones digitales escalables, combinando creatividad y tecnología para crear aplicaciones eficientes que satisfacen las necesidades del usuario y mejoran la experiencia digital.
Nuestros servicios
Soluciones digitales personalizadas que optimizan y automatizan tus procesos.


Desarrollo
Creamos aplicaciones web a medida que se adaptan a las necesidades específicas de tu negocio.
Análisis
Transformamos datos complejos en información clara para tomar decisiones inteligentes.
Únete a delavegalabs
Recibe novedades y consejos tecnológicos